Australia's solar generation soared by 700MW in Q1
Five new solar farms totalling 326MW capacity started generation during the quarter.
Australia’s rooftop and grid solar generation increased approximately 700MW on average in Q1 2019, with 2,173MW of new grid scale capacity commencing generation since Q1 2018, according to the latest figures from the Australian Energy Market Operator (AEMO).
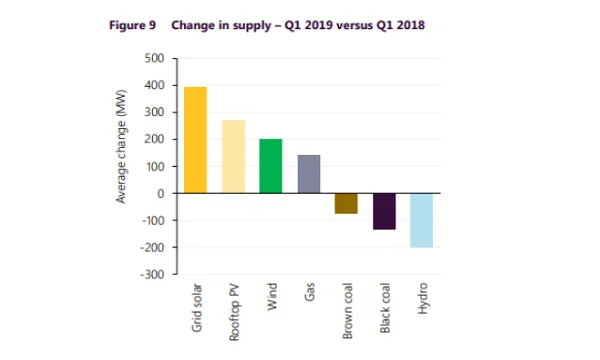
Compared to Q1 2018, average large-scale wind and solar generation jumped 39% YoY from 1,521MW to 2,116MW. Average wind generation increased by 201MW whilst large-scale solar generation increased by 394 MW.
“The rapid deployment of large-scale solar generation has continued with five new solar farms totalling 326MW capacity commencing generation in Q1 2019,” AEMO noted. Of this new large-scale solar capacity, four solar farms commenced generation in Queensland (231MW), and one in South Australia (95MW).
In Q1 2019, large-scale solar met 5% of total midday operational demand, from 1% in Q1 2018, due to more than 2GW of large-scale solar capacity that have began generation since the beginning of 2018, particularly in South Australia and Queensland, with around 8% of demand met by large-scale solar.

Of note, the shape of Victoria’s large-scale solar generation profile illustrates the impact of solar tracking technology, AEMO noted. “During summer, tracking systems capture more direct solar radiation for longer periods of the day. This combined with the sizing of the inverter results in a flatter generation profile and higher capacity factors. In 2018, more than two-thirds of new grid solar capacity came from systems utilising single-axis tracking,” the firm said.
AEMO further added that between Q1 2018 and Q1 2019, average rooftop PV generation jumped 27% from 995MW to 1,268MW. The largest increase was recorded in New South Wales (30%), with substantial increases also occurring in Victoria (28%) and South Australia (28%). Increases in generation correspond with a record amount of installed rooftop PV capacity over 2018, and 2019 so far.
Meanwhile, black coal-fired generation reduced by 133MW on average, reflecting a displacement by solar during the daytime, shifts into higher priced bands, and a 217MW reduction in average availability.
By region, Queensland black coal-fired generation decreased by 132MW on average, whilst New South Wales black coal-fired generation remained unchanged. The largest changes in average output between quarters were at the Liddell (+232MW), Mt Piper (-279MW), Gladstone (-125MW) and Stanwell (-74MW) power stations.

Similarly, brown coal-fired generation reduced by 76MW on average when compared to Q1 2018, largely due to reduced availability and output at Loy Yang A and Yallourn power stations.
Hydro output also decreased by 200MW on average, due to dry conditions and low storage levels during the quarter.
“Tasmania’s quarterly average hydro output was consistent with historical Q1 results, but 56MW lower than Q1 2018,” AEMo explained. “Average output decreased by 392MW, with the largest reductions in generation from Gordon and Poatina.”
The reduction reportedly coincided with below average rainfall across most of Tasmania, which meant their total energy in storage reduced from around 40% at the start of the quarter to 31% at quarter end.
Gas-powered generation also recovered from its record low quarterly output in Q4 2018, climbing by 143MW on average in Q1. The increase occurred predominantly in the evening peak period, coinciding with higher spot electricity prices and declining solar output.






 Advertise


